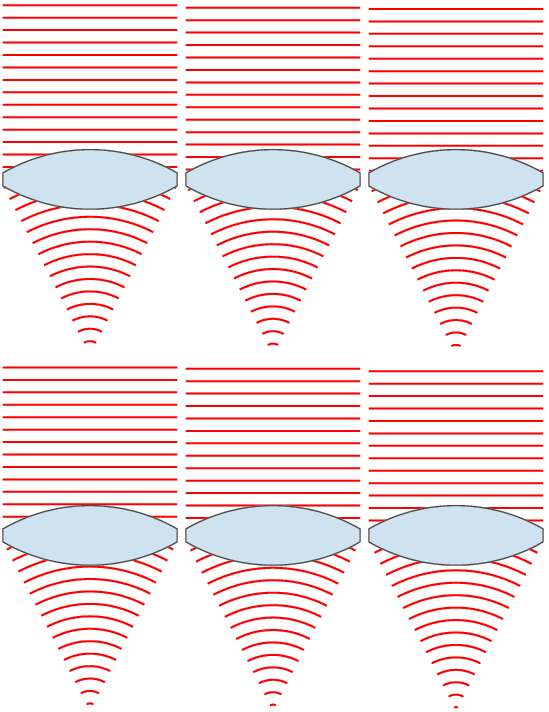
Fichier:Lens and wavefronts.gif

Le contenu de la page n’est pas pris en charge dans d’autres langues.
Un livre de Wikilivres.

Lens_and_wavefronts.gif(183 × 356 pixels, taille du fichier : 35 kio, type MIME : image/gif, en boucle, 9 trames, 0,7 s)

slnglelens

Description

Description Illustration of wavefronts after passing through a lens. Interestingly, to produce a point source reverse the direction of the waves, with the focus point acting as a point source.
Date (UTC)
Source self-made with MATLAB
Auteur Oleg Alexandrov
Autres versions
 
Ce diagramme a été créé avec MATLAB.

Conditions d’utilisation

Public domain Moi, propriétaire des droits d’auteur sur cette œuvre, la place dans le domaine public. Ceci s'applique dans le monde entier.
Dans certains pays, ceci peut ne pas être possible ; dans ce cas :
J’accorde à toute personne le droit d’utiliser cette œuvre dans n’importe quel but, sans aucune condition, sauf celles requises par la loi.

siingleline

% Illustration of planar wavefronts going through a lens and getting focused
% into a converging spherical wave

function main ()

  % lens index
   n=1.5; 

  % number of points, used for plotting
   N = 100;

  % radii of lens surfaces
   R1 = 0.5; 
   R2 = 1.5;

  % centers of circles (y coord is 0)
   O1 = -2.9;
   O2 = -O1;

  % focal length
   f = (n-1)*(1/R1+1/R2); f = 1/f;
   
   % theta0 determines the width of the lens
   theta0=pi/6;
   Theta = linspace(-theta0, theta0, N);

  % right face of the lens
   L1x = R1*cos(Theta)+O1;
   L1y =R1*sin(Theta); 

   % left size of the lens
   L2x=-R2*cos(Theta)+O2;
   L2y = R2*sin(Theta);

   % flat top part
   Topx = [L1x(N), L2x(N)];
   Topy = [L1y(N), L2y(N)];

   % flat bottom part
   Botx = [L1x(1) L2x(1)];
   Boty = [L1y(1), L2y(1)];

   % the lens
   Lensx = [L1x rv_vec(Topx), rv_vec(L2x), Botx];
   Lensy = [L1y rv_vec(Topy), rv_vec(L2y), Boty];

   % Parameters for graphing
   Lens_color  = [204, 226, 239]/256;
   Lens_border = 0.3*[1, 1, 1];
   lbw = 1.3; % lens border width
   wavefr_color = [1, 0, 0];
   wavefr_bdw   = 2;
   
   % spacing between wavefronts (both plane and spherical ones)
   spacing = 0.25;

   % 2*H is the height of the plane wavefronts
   H = L1y(N); 

   % theta2 = slope of the line going from the upper-right
   % end of the lens to the focus point
   theta2 = atan(L1y(N)/(f-L1x(N)));

   % Shape of the spherical wavefronts.
   Theta = linspace(-theta2, theta2, N);
   X = -cos(Theta);
   Y =  sin(Theta);

   S = -f; % start ploting waves from here to the right

   % number of frames in the movie
   num_frames = 10;
   Shifts = linspace(0, spacing, num_frames+1);

   % start at S+shift, plot the wavefronts
   for frame_no = 1:num_frames

      shift = Shifts(frame_no);
      
      s = S+shift;

      % plotting window
      figure(1); clf; hold on; axis equal; axis off;

      % plot the plane wavefronts
      while s < 0
         plot([s, s], [-H, H], 'color', wavefr_color, 'linewidth', wavefr_bdw);
         s = s + spacing;
      end
      
   
      % plot the spherical wavefronts
      s = s - 10*spacing; % backtrack a bit
      while s < f
         
         rho = f-s;
         
         if rho*Y(N) <= L1y(N)
            plot(rho*X+f, rho*Y, 'color', wavefr_color, 'linewidth', wavefr_bdw);
         end
         
         s = s + spacing;
         
      end

      % plot the lens
      fill(Lensx, Lensy, Lens_color, 'EdgeColor', Lens_border, 'LineWidth', lbw);
%      get(H)
%      return
      
      % Invisible points to force MATLAB to keep the
      % plotting window fixed.
      tiny = 0.15*spacing;
      white = 0.999*[1, 1, 1];
      plot(S-tiny,   H+tiny, 'color', white);
      plot(S-tiny,  -H-tiny, 'color', white);
      plot(f+tiny,   H+tiny, 'color', white);
      plot(f+tiny,  -H-tiny, 'color', white);

      % Rotate by 90 degrees
      set(gca, 'View', [90, 90])

      % save current file
      frame_file = sprintf('Frame%d.eps', 1000+frame_no);
      disp(frame_file);
      saveas(gcf, frame_file, 'psc2');
      pause(0.07)
   end

% The frames were converted to a movie with the command
% convert -antialias -loop 10000  -delay 8 -compress LZW Frame100* Lens_and_wavefronts.gif
   
function W = rv_vec(V)

   K = length(V);

   W = V;
   for i=1:K
      W(i) = V(K-i+1);
   end

Légendes

Ajoutez en une ligne la description de ce que représente ce fichier
Siingleline

Éléments décrits dans ce fichier

dépeint

image/gif

Historique du fichier

Cliquer sur une date et heure pour voir le fichier tel qu'il était à ce moment-là.

Date et heureVignetteDimensionsUtilisateurCommentaire
actuel25 novembre 2007 à 08:35Vignette pour la version du 25 novembre 2007 à 08:35183 × 356 (35 kio)Oleg Alexandrovtweak
24 novembre 2007 à 06:10Vignette pour la version du 24 novembre 2007 à 06:10171 × 356 (33 kio)Oleg Alexandrovtweak
24 novembre 2007 à 06:09Vignette pour la version du 24 novembre 2007 à 06:09171 × 356 (33 kio)Oleg Alexandrovtweak
24 novembre 2007 à 02:56Vignette pour la version du 24 novembre 2007 à 02:56171 × 359 (33 kio)Oleg Alexandrovtweak, same license
24 novembre 2007 à 02:53Vignette pour la version du 24 novembre 2007 à 02:53171 × 359 (32 kio)Oleg Alexandrovtweak
24 novembre 2007 à 02:49Vignette pour la version du 24 novembre 2007 à 02:49151 × 359 (31 kio)Oleg Alexandrov{{Information |Description=Illustration of wavefronts after passing through a [:en:lens (optics)|lens]] |Source=self-made with MATLAB |Date=~~~~~ |Author= Oleg Alexandrov |Permission=see below |other_versions= }}

La page suivante utilise ce fichier :

Usage global du fichier

Les autres wikis suivants utilisent ce fichier :

Voir davantage sur l’utilisation globale de ce fichier.