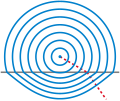
Fichier:Snells law wavefronts.svg

Le contenu de la page n’est pas pris en charge dans d’autres langues.
Un livre de Wikilivres.

Fichier d’origine(Fichier SVG, nominalement de 410 × 342 pixels, taille : 68 kio)

Description Illustration of wavefronts in the context of Snell's law.
Date (UTC)
Source self-made with MATLAB
Auteur Oleg Alexandrov
Public domain Moi, propriétaire des droits d’auteur sur cette œuvre, la place dans le domaine public. Ceci s'applique dans le monde entier.
Dans certains pays, ceci peut ne pas être possible ; dans ce cas :
J’accorde à toute personne le droit d’utiliser cette œuvre dans n’importe quel but, sans aucune condition, sauf celles requises par la loi.

Source code (MATLAB)

% Illustration of Snell's law
function main()
   n1=1.0;
   n2=1.5;

   figure(1); clf; hold on; axis equal; axis off;
   sign = -1;% is the source up or down?
   O=[0, -1*sign];
   k=500;

   
% KSmrq's colors
   red    = [0.867 0.06 0.14];
   blue   = [0, 129, 205]/256;
   green  = [0, 200,  70]/256;
   yellow = [254, 194,   0]/256;
   white = 0.99*[1, 1, 1];
   black = [0, 0, 0];
   gray = 0.5*white;

   color1=red;
   color2=blue;
   color3=gray;
   lw = 4;
   
   plot_line=0;
   Theta=linspace(0, 2*pi, k);
   V=0*Theta; W=0*Theta;
   S0=4;
   spacing=0.45;
   p=floor(S0/spacing);
   S=linspace(0, S0, p+1)+0.1*spacing;

   % plot the interface between diellectrics
   L=3.8;
   plot([-L, L], [0, 0], 'color', color3, 'linewidth', lw);


% plot a ray
   plot_line=1;
   s=5.2;
   theta=pi/3; wfr(s, theta, n1, n2, O, sign, plot_line, color1, lw);

% plot the wafefronts
   plot_line=0;
   for i=1:p
      for j=1:k
	 s=S(i);
	 theta=Theta(j);
	 [V(j), W(j)]=wfr(s, theta, n1, n2, O, sign, plot_line, color1, lw);
      end
      plot(V, W, 'color', color2, 'linewidth', lw);
   end


   % dummy point to enlarge the bounding box
   plot(0, S0+1.5*spacing, '*', 'color', white);

   saveas(gcf, 'Snells_law_wavefronts.eps', 'psc2')
   %plot2svg('Snells_law_wavefronts.svg')

function [a, b]=wfr(s, theta, n1, n2, O, sign, plot_line, color1, lw);

   X=O+s*[sin(theta), sign*cos(theta)];

  if( sign*X(2) > 0 )
    t=-sign*O(2)/cos(theta);
    X0=O+t*[sin(theta), sign*cos(theta)];
    
    if (plot_line == 1) 
      plot([O(1), X0(1)], [O(2), X0(2)], 'color', color1, 'linewidth', lw, 'linestyle', '--');
    end

    d = norm(O-X0);
    r = (s-d)*(n2/n1)^(sign);

    theta2=asin(n1*sin(theta)/n2);
    XE=X0+r*[sin(theta2), sign*cos(theta2)];
  else
    XE = X;
  end  
  a = XE(1);
  b = XE(2); 

  if (plot_line==1)
    plot([X0(1), XE(1)], [X0(2), XE(2)], 'color', color1, 'linewidth', lw, 'linestyle', '--');
  end

Légendes

Ajoutez en une ligne la description de ce que représente ce fichier

Éléments décrits dans ce fichier

dépeint

Historique du fichier

Cliquer sur une date et heure pour voir le fichier tel qu'il était à ce moment-là.

Date et heureVignetteDimensionsUtilisateurCommentaire
actuel6 janvier 2008 à 06:18Vignette pour la version du 6 janvier 2008 à 06:18410 × 342 (68 kio)Oleg AlexandrovTweak bd box, same license
5 janvier 2008 à 22:24Vignette pour la version du 5 janvier 2008 à 22:24512 × 427 (68 kio)Oleg Alexandrov{{Information |Description=Illustration of wavefronts in the context of Snell's law. |Source=self-made with MATLAB |Date=~~~~~ |Author= Oleg Alexandrov |Permission= |other_versions= }} {{PD-

Usage global du fichier

Les autres wikis suivants utilisent ce fichier :